General Motors Posts Best June Sales Since 2007
GM dealers delivered 267,461 vehicles in the United States in June. Total sales were up 1 percent compared to a year ago. Retail sales were up 1 percent and fleet sales were up 2 percent.
There were two fewer selling days in June compared with a year ago. On a selling- day adjusted basis, GM’s total sales were up 9 percent. Retail deliveries were up 9 percent and fleet sales were up 10 percent.
The seasonally adjusted annual selling rate (SAAR) for light vehicles in June was an estimated 16.6 million units, topping 16 million units for the fourth consecutive month.
The estimated SAAR for the first half of the year was 16.1 million, which is within GM’s full-year forecast of 16.0 million to 16.5 million units.
June Sales Highlights (vs. 2013 except as noted)
- Buick had its best June since 2006. Deliveries were up 18 percent, driven by an 82 percent increase in Encore deliveries, a 33 percent increase for LaCrosse, a 26 percent increase for Regal and a 5 percent increase for Enclave.
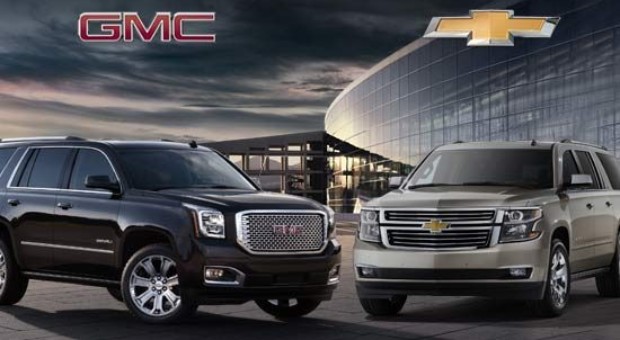
- GMC also had its best June since 2006. Deliveries were up 11 percent driven by strong demand for the redesigned Yukon, up 120 percent, as well as the Yukon XL, up 70 percent; the Terrain, up 8 percent; and the Savana, up 129 percent.
- Deliveries of the Chevrolet Spark and Sonic were up 19 percent and 36 percent, respectively.
- Deliveries of the Chevrolet Tahoe were up 93 percent and Suburban sales were up 73 percent. Traverse was up 3 percent and Silverado was up 1 percent.
- Cadillac sales were up, with Escalade up 57 percent and SRX up 19 percent. It was Cadillac’s best June since 2008, and 57 percent of customers did not trade in a Cadillac.
- GM’s average transaction prices (ATPs) were in line with April and May, with higher pickup, SUV and Cadillac ATPs offsetting declines among cars and crossovers, according to mid-month J.D. Power PIN estimates.
- For the second quarter, ATPs were up about $800 per unit versus the first quarter. Calendar year to date, ATPs are up about $2,700 compared with a year ago.
- Incentive spending as a percentage of ATP was 10.9 percent, up 0.2 points from a year ago, according to J.D. Power PIN estimates. The industry average for June was 9.7 percent, also up 0.2 points from a year ago.
Source, please read more.

